
International Conference on Learning Representations (ICLR) is one of the leading conferences in machine learning out there, attracting thousands of participants from academia and industry each year. One of the great things about this conference is its reviewing process. It’s double-blind as you would expect, but, unlike other big conferences such as ICML and NeurIPS, it has open reviews for all the submitted papers with discussions between the authors and the reviewers and their scores. We decided to use this opportunity to analyze this year’s papers.
Disclaimer: the analysis is performed on 3 December 2019, while the paper results are not finalized yet, hence some stats may differ from the final one.
![]()
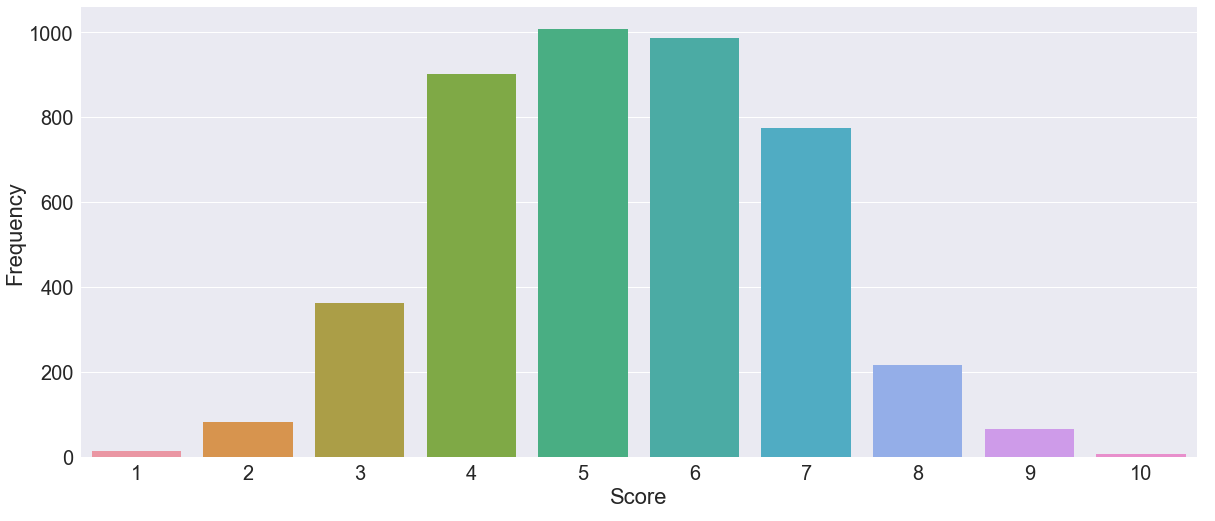
First, let’s look at some raw numbers. There are 1449 submitted papers, which is 55% increase from the last year’s number (935 papers in 2018). If the acceptance rate is the same for this year as for 2018 (approximately 36%), then we can expect more than 500 accepted papers. On average, reviewers give 5.4-score on 1-10 scale being “3.8-confident” in their scores (on 1-5 scale).
The distribution of scores presented below show that the curve pretty much follows normal distribution, where most of the mass is located around the center. Very few reviewers give highest and lowest scores: only 6 papers with 10-score and 13 papers with the score of one.
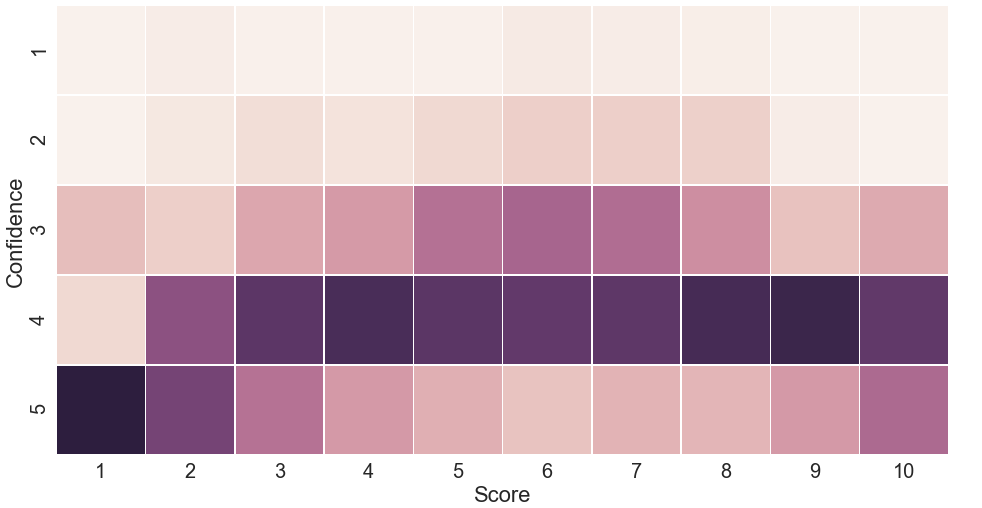
Then we plot the confidence of reviewers in their scores. The brighter color of a cell is, the more confidence reviewers have for this score. The confidence values are normalized for each score. As seen for confidence values of three and four, people assess papers in the middle of 10-scale; while extreme scores, such as 1 and 10, receive the highest confidence 5. Read differently, when reviewers estimate the work very positively or very negatively they are very confident in their actions.
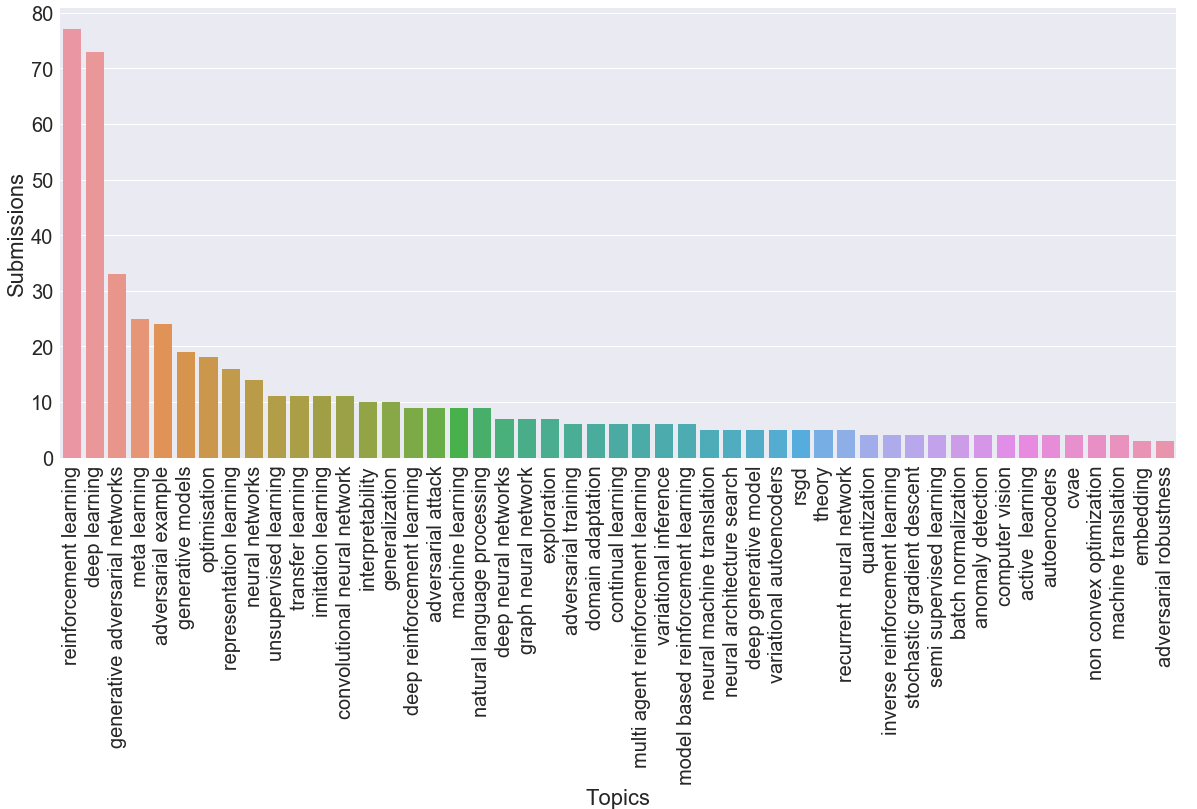
Now let’s take a look at the frequencies of topics of the submitted papers. Topics shed the light on the current trends of this conference and as a consequence of machine learning in general. To define the topic of a paper, we first extract the keywords provided by the authors and then measure the Levenshtein distance to collapse keywords that differ by just a few letters from each other. So, for example, terms “gcn”, “gcnn”, and “gcnns” get the same topic “gcn”, while “gan” obtain its separate topic. In the graph below, for the ease of analysis, we use only the first keyword and don’t consider submissions with no keywords. With a big gap the most popular topics are Reinforcement Learning, followed by a more general topic of Deep Learning. GANs, Meta Learning, and Adversarial Examples conclude top-5 topics of this year. Other types of works that are amongst the most popular of this year are other variants of learning (e.g. representation, transfer, unsupervised) and optimization methods (e.g. optimization, rsgd, adam).
Finally, let’s look at the top-3 papers among all papers.
| Title | Average Rating | Average Confidence | Topic |
| ALISTA: Analytic Weights Are As Good As Learned Weights in LISTA | 8.7 | 4.7 | Sparse Recovery |
| Generating High Fidelity Images With Subscale Pixel Networks and Multidimensional Upscaling | 8.7 | 3.7 | – |
| Benchmarking Neural Network Robustness to Common Corruptions and Perturbations | 8.3 | 4 | Robustness |
At last, we open-sourced our analysis so that you can run your experiments, read the reviews, or browse the papers filtered on your research interests. We used Qgrid to interactively work with dataframes, which provide extra functionalities such as sorting, resizing, or filtering with a click of a button and for those who don’t want to install it locally you can directly work on the notebook in your browser, via Binder, where all packages are already installed.
Post written by :
 |
|
Sergey Ivanov, Research Scientist, Criteo AI Lab |